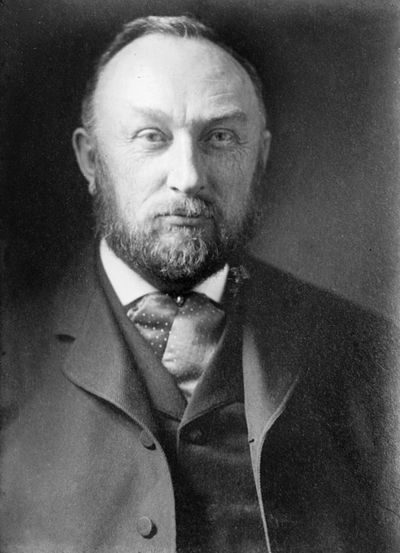
Edward Charles Pickering was not just an observer of the night sky; he was the architect of a system that made it possible to quantify it. Born in Boston in 1846, the physicist and astronomer died in Cambridge in 1919, but his legacy is etched into the data we still use today. Before his interventions, astronomy was largely about pointing telescopes and noting positions. Pickering turned it into a rigorous, measurable science.
His first major move came at the Massachusetts Institute of Technology. In 1867, he became a professor of physics there. But he didn’t just lecture. He built the first U.S. laboratory where students had to use instruments to take measurements. No more hand-waving. If you couldn’t measure it, you hadn’t really studied it. This shift from theoretical speculation to empirical data gathering defined his career.
The Invention That Made Cataloging Possible
The core of Pickering’s early fame rests on a device he invented: the meridian photometer. It sounds dry. The impact was not.
Prior to this tool, comparing the brightness of stars was an exercise in guesswork. One eye looked at a star, the other at a reference. Human eyes lied. They tired. They played tricks. The meridian photometer used a calcite prism to juxtapose the image of a target star against a designated group of north polar stars. It allowed for a direct, optical comparison of brightness. It removed the human variable.
Using this device, Pickering compiled the Harvard Photometry in 1884. This was the first great photometric catalog. It wasn’t just a list. It was a standardized scale. For the first time, astronomers across the world could look up a star’s magnitude and trust that the number meant the same thing it did for someone else. This was the birth of consistent astronomical data.
Expanding the View: From North to South
In 1876, Pickering moved to the Harvard College Observatory as professor of astronomy and director. The scope of his ambition grew with the institution. But there was a problem. The northern stars were well-documented. The southern hemisphere was a black hole in the data.
To fix this, Pickering pushed for the establishment of the Arequipa Observatory in Peru. It opened in 1891. Suddenly, the Harvard College Observatory could measure southern stars. The data became global.
Under his direction, the work expanded into three critical areas:
1. Photometry: A refined scale of photographic magnitudes that translated light intensity into numbers.
2. Variable Star Classification: A system to categorize stars that changed brightness over time.
3. Stellar Spectroscopy: A method for analyzing the light spectra of stars.
This system of stellar spectroscopy became the universal standard. It wasn’t just adopted by Harvard. It was adopted by everyone. For decades, if you were an astronomer, you used Pickering’s framework.
The Unseen Hands Behind the Data
The Harvard Photometry and the subsequent catalogs were not the work of one man. Pickering realized that the sheer volume of data required more eyes than he had. He hired a team of women, often referred